Gary Goforth, P.E., Ph.D.
Environmental Engineering and Water Resources Management
![]()
![]()
![]()
![]()
![]()
![]()
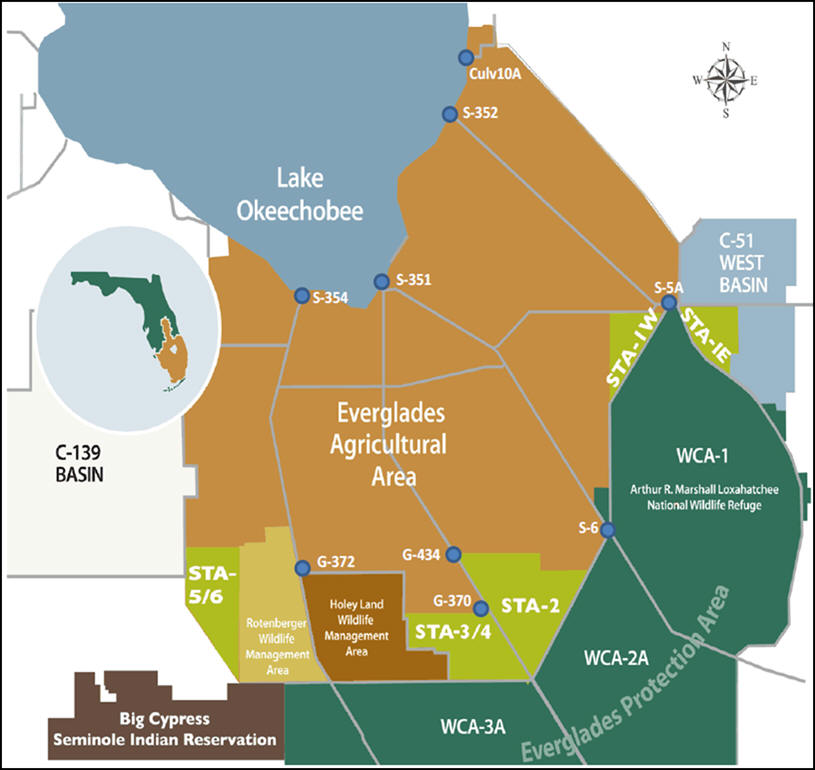
EVERGLADES CONSTRUCTION PROJECT
STORMWATER TREATMENT AREAS (STAs)
![]()
![]()
![]()
![]()
![]()
![]()
Link to real-time STA hydrologic data
| Summary of STA Performance - Average Annual values | |||||||
| STA-1E | STA-1W | STA-2 | STA-3/4 | STA-5 (Note 1) | STA-6 | Total | |
| Effective Treatment Area (acres) | 4,318 | 3,819 for WY95-00; 6,670 WY2001-present | 8,089 | 15,785 | 5,600 | 1,107 | 41,569 |
| Period of Record | 5/05-4/16 | 8/94-4/16 | 5/01-4/16 | 5/04 - 4/16 | 5/00-4/16 | 5/98-4/16 | 8/94-4/16 |
| Average Annual Inflow (AF/yr) | 110,577 | 182,119 | 293,863 | 464,934 | 97,383 | 47,519 | 1,196,395 |
| Hydraulic Loading Rate (cm/day) | 1.36 | 2.43 | 2.43 | 2.46 | 1.18 | 2.95 | 2.18 |
| Average Annual TP Loading (kg/yr) | 23,191 | 39,341 | 35,545 | 60,952 | 26,700 | 5,986 | 191,714 |
| Phosphorus Loading Rate (g/m2/yr) | 1.42 | 1.56 | 0.87 | 0.95 | 1.18 | 1.10 | 1.12 |
| Average Inflow TP (ppb) | 170 | 175 | 98 | 106 | 222 | 102 | 130 |
| Average Outflow TP (ppb) | 38 | 47 | 21 | 16 | 77 | 35 | 30 |
| Total P load removed (kg) | 197,910 | 617,359 | 157,948 | 221,264 | 159,273 | 35,112 | 1,388,866 |
| Removal % | 79% | 72% | 78% | 85% | 68% | 72% | 85% |
| Average Removal Rate (g/m2/yr) | 1.12 | 1.37 | 1.07 | 0.81 | 0.65 | 0.80 | 0.96 |
| Note 1: STA-5 results include the combined STA-5/6 beginning WY2016 | |||||||
Summary of Vegetation Management Practices in the STAs
Summary of STA Operations and Performance
The Operational Design Envelope for the STAs
A day in the field ...
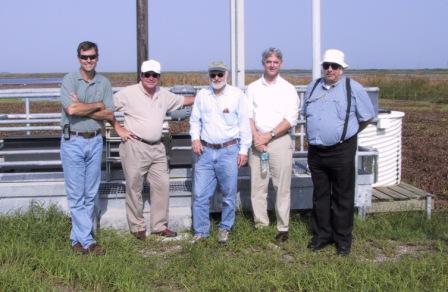
Gary Goforth Galen Miller Bill Walker Tom DeBusk Bob Kadlec